Google's Spam Update Began and Our Impressions Fell 62% in One Day. They Had Jumped 6.3× Two Weeks Earlier. What Our Search Console Can and Cannot Say
Disclosure
This article is promotional content produced as part of the Semrush Creator Accelerator programme. It contains affiliate links to Semrush — if you buy through them we may earn a commission at no extra cost to you — and we may also receive a reward from Semrush for publishing it. All measurements in this article are our own. Semrush did not supply, review or approve the data, and the conclusions we draw are ours.
When a ranking update lands, the first chart most people open is Search Console, and the first thing they look for is a cliff. We had one. On 24 September 2026, the day Google began its September spam update, our impressions fell by more than half.
It took one more step to see that the cliff was the wrong shape to read. We are publishing the whole record, because most "did the update hit us?" posts show only the part after the drop.
Put your rankings on the update's calendar
Track your keywords daily against the update dates with Position Tracking. To get it together with the AI Visibility Toolkit in one subscription, try Semrush One free for 7 days.
What Google says happened
Google's Search Status Dashboard lists the September 2026 spam update as released on 24 September 2026 (at 16:15 UTC, which is 9:15 a.m. Pacific), "which applies globally and to all languages", with "The rollout may take up to two weeks to complete". A later note reads "The rollout was complete as of October 8, 2026" (Google Search Status Dashboard). Google called it a spam update and did not say what it targeted.
So the rollout window is 24 September to 8 October. Search Console reports in Pacific time, which matters for the first day.
The chart most people would screenshot
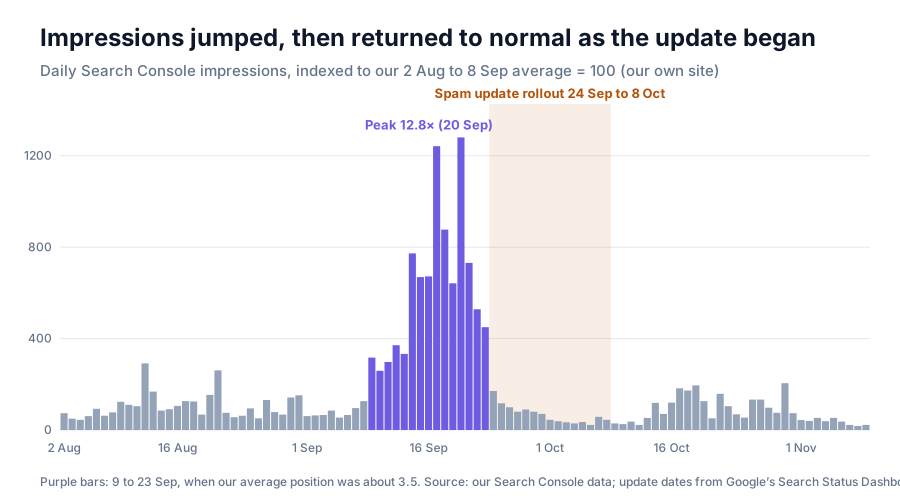
On 23 September our impressions were at one level. On 24 September, the day Google began, they were 61.9% lower, and 74.0% lower two days later. Taken alone, that is a textbook "we got hit".
The part before the drop
Look left of the shaded block. Our baseline for 2 August to 8 September was an index of 100.
| Window | Impressions (index) | Average position | Click-through rate |
|---|---|---|---|
| 2 Aug to 8 Sep (baseline) | 100 | 21.8 | 3.03% |
| 9 to 23 Sep (the surge) | 629 | 3.5 | 0.29% |
| 24 Sep to 8 Oct (rollout) | 67.5 | 10.5 | 5.37% |
| 9 Oct to 9 Nov (after) | 82.2 | 10.0 | 4.68% |
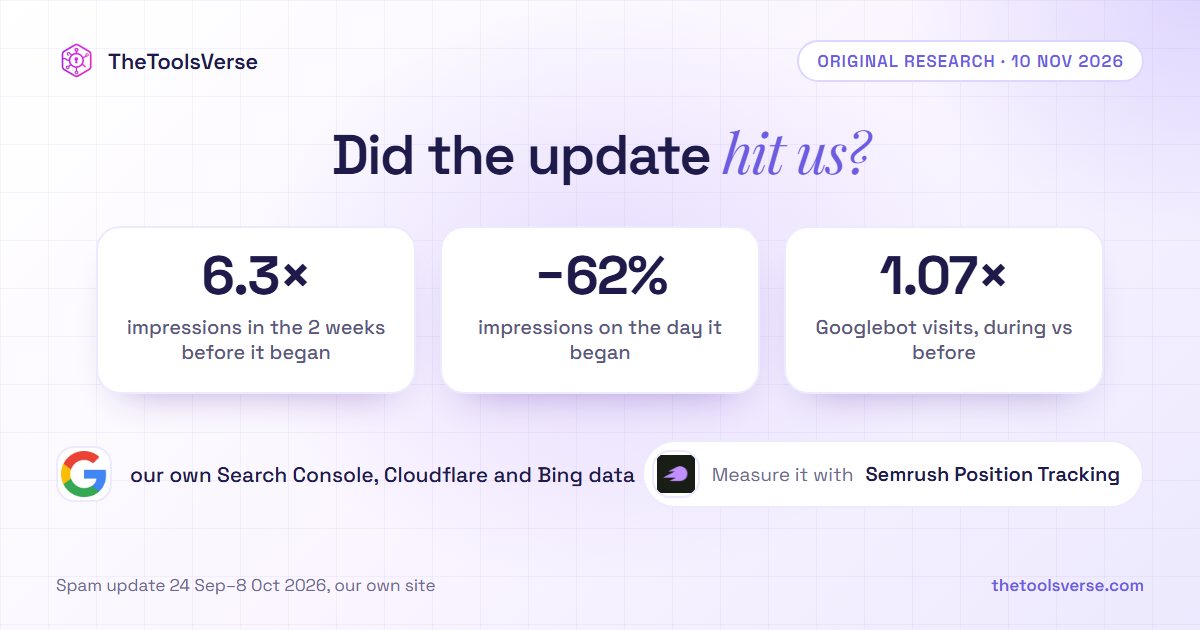
Two weeks earlier, from 9 September, our impressions had risen to about 6.3 times the baseline, peaking at 12.8 times on 20 September. Our average position over those days was 3.5, against 21.8 before, and the click-through rate fell to 0.29%.
That pattern, a large rise in impressions at excellent positions with no matching rise in clicks, is not what a healthy ranking gain looks like. Something put our pages in front of many more searches and almost nobody clicked. The impressions were also spread thin: the 15 pages with the most impressions account for only about 5.7% of the surge window's total, and we could not identify the queries behind it.
What the update window looks like against the baseline
The change on 24 September was a return, not a collapse. During the rollout our impressions averaged 0.68 times the August baseline, and after it 0.82 times. In the same periods our average position was 10.5 and 10.0, better than the baseline's 21.8, and our click-through rate was higher than at baseline.
We will not read anything into clicks. We have so few per day that a change of one or two is noise, so the honest statement is that clicks did not fall in either period. We cannot say they rose.
Two things that did not move
- Googlebot. Our Cloudflare logs show Googlebot's daily visits in the 15 days of the rollout at 1.07 times their level in the 15 days before it. If the update had changed how Google crawled us, this is where we would have expected to see it.
- Bing. Bing's page report shows weekly impressions, indexed to August, between 71 and 141 across the same months. Over the weeks when Google's number moved 6.3 times and then fell back, Bing's never moved more than about 40% above the August average. A spike in one engine only is a reason to look at that engine's own behaviour before blaming a change in the site. (Bing's report lists only pages with search activity, so it understates the total.)
What we cannot say
- That the update did not touch us. A spam update can change rankings for many pages by small amounts, and with this little traffic we could not see them.
- What caused the surge. We have not found a cause, and Search Console did not let us trace it to queries.
- Why it ended on 24 September. The timing is close, and a close timing is not a cause. Google's own note gives no target for the update.
- Whether our position improved because of the update. It improved in the same period, and the data cannot separate the two.
How to read a drop without a verdict
- Zoom out before you zoom in. Look at six weeks before the update, not six days. A drop from a spike is a different story from a drop from a plateau.
- Read impressions, position and clicks together. Impressions at position 3 with a 0.3% click-through rate are not wins you can lose.
- Check a second engine and a second signal. Bing, and the crawl rate, tell you whether the change was in Google's view of you or in your site.
- Write down the update calendar and the dates of your own changes, side by side.
- Say "we cannot tell" when you cannot. A confident wrong cause sends a team to fix the wrong thing.
Put your rankings on the calendar
Track keyword positions every day. Position Tracking in the SEO Toolkit records visibility and average position for the keywords you choose, so a shift can be laid against an update's dates. It can also notify you when positions change.
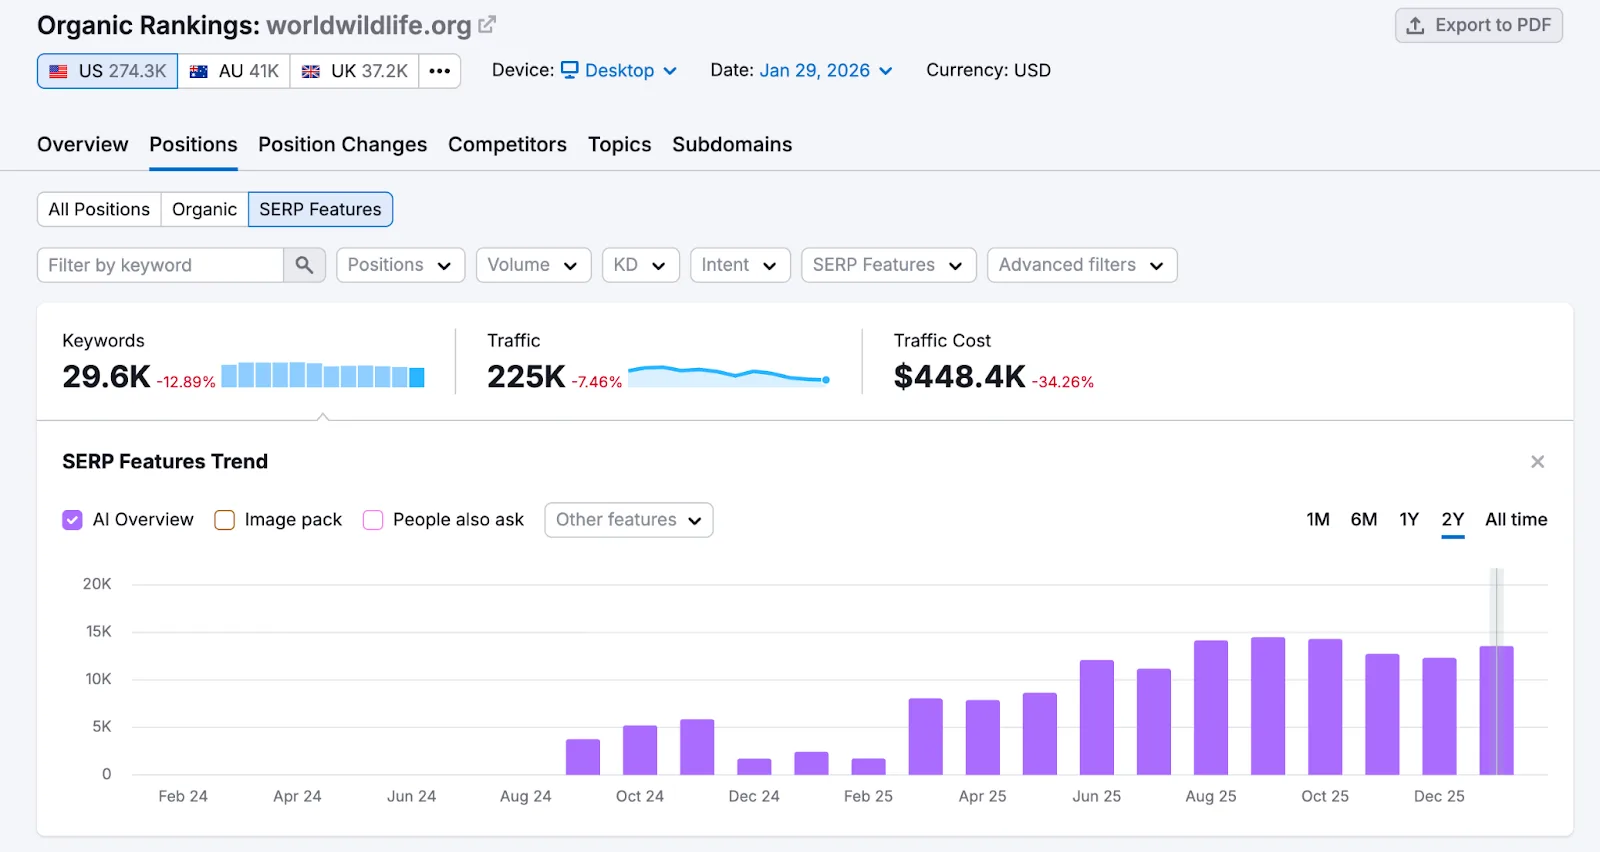
See how a competitor's visibility moved. Organic Rankings shows a domain's ranking keywords and visibility trend over time, for yours or a rival's, so you can check whether others moved when you did.
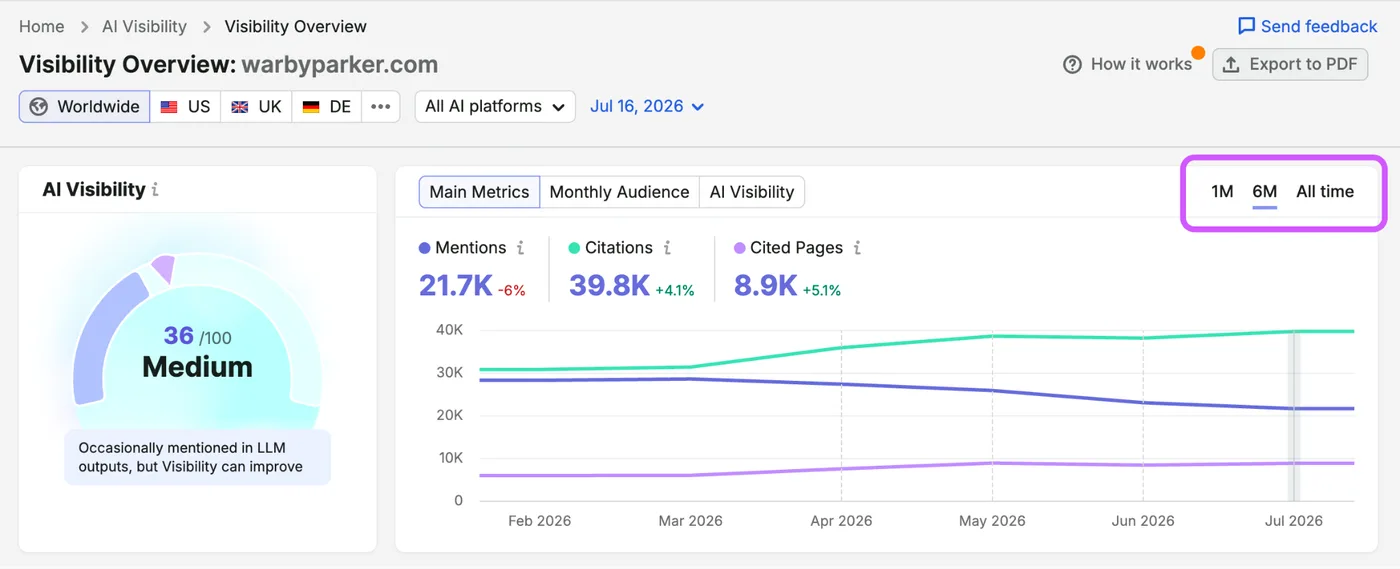
Check the AI side of visibility. Visibility Overview in the AI Visibility Toolkit tracks mentions and citations across AI platforms, so a drop in one place can be compared with what AI answers did over the same weeks.
The AI Visibility Toolkit has no free trial of its own; the 7-day free trial is Semrush One's, which includes it alongside the SEO Toolkit. To put your own rankings and AI visibility on one calendar before the next update, try Semrush One free for 7 days: its page offers "Unlimited access to all Semrush One tools", checked on 16 October 2026. Those are Semrush's published terms, not something we tested; none of the data above came from a Semrush account.
A drop is a question, not an answer
On the day it started, the update looked like it had cost us more than half our impressions. Against the longer record, it was the end of a two-week spike that had brought no visitors. The skill is not spotting the drop; it is knowing what it dropped from.
Try Semrush One free for 7 days
Position Tracking in the SEO Toolkit to lay your rankings against update dates, and Visibility Overview in the AI Visibility Toolkit for the AI side, together in Semrush One. Free for 7 days for new users.
Try Semrush One free for 7 daysWhere the numbers come from
- Search Console: the domain property, WEB search, daily impressions, clicks and average position, 2 August to 9 November 2026 (10 November is partial and excluded). Windows: baseline 2 August to 8 September (38 days), surge 9 to 23 September, rollout 24 September to 8 October, after 9 October to 9 November. Average position is weighted by impressions. Search Console reports in Pacific time.
- Update dates: the incident record on Google's Search Status Dashboard, read on 10 November 2026.
- Googlebot: page views by the GoogleBot user-agent family in Cloudflare's analytics, 9 to 23 September and 24 September to 8 October.
- Bing: page-level weekly impressions from Bing Webmaster Tools, indexed to the average of the four August weeks.
- Not shown: our absolute traffic numbers, which queries produced the surge, and any claim about why the update's timing and our numbers line up.
- Reproduce it: the saved data and script are in our research folder (
research/r2-c5-spam-update/).
Some links may be affiliate links. We may earn a small commission at no extra cost to you.
Related Articles
Explore more guides and reviews from our experts.
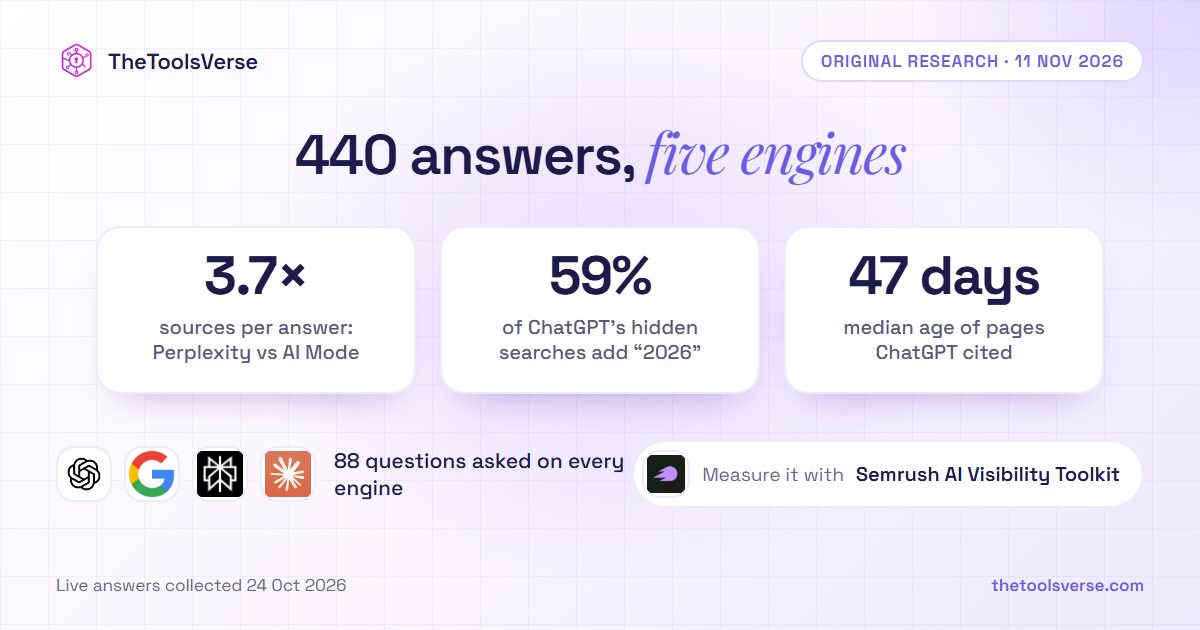
We Asked 88 Questions on 5 AI Engines. Perplexity Cited 3.7 Times as Many Sources as Google AI Mode, and ChatGPT's Hidden Searches Add "2026" to 59% of Queries
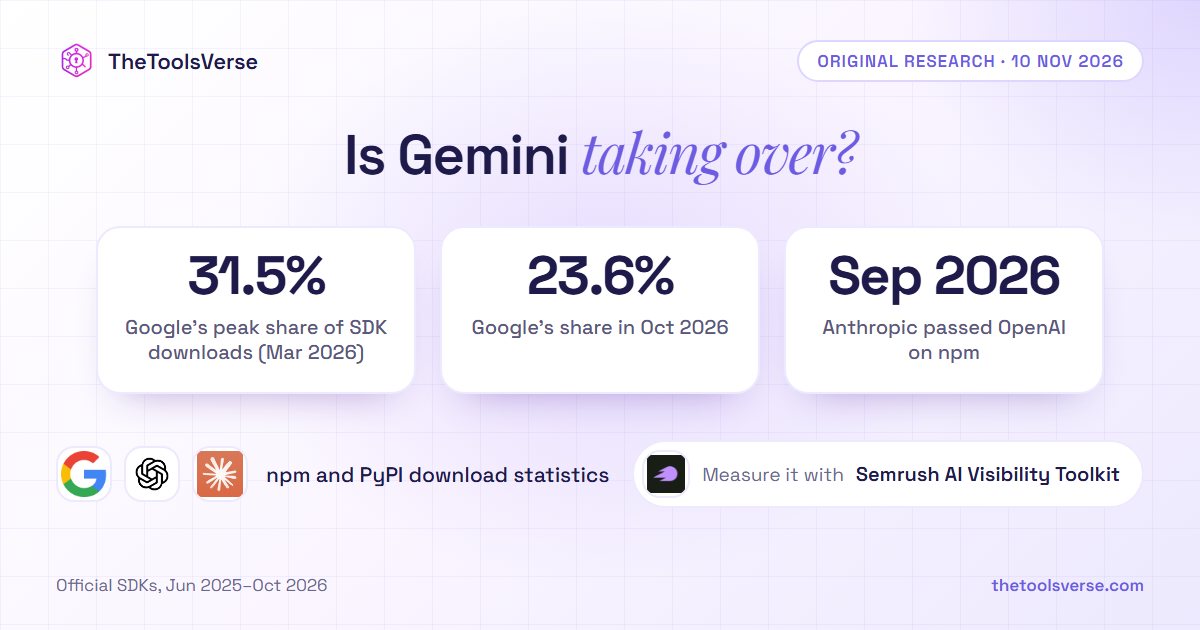
Is Gemini Overtaking ChatGPT? In Developer Downloads, Gemini's Share Peaked in March and Anthropic Passed OpenAI: 17 Months of SDK Data