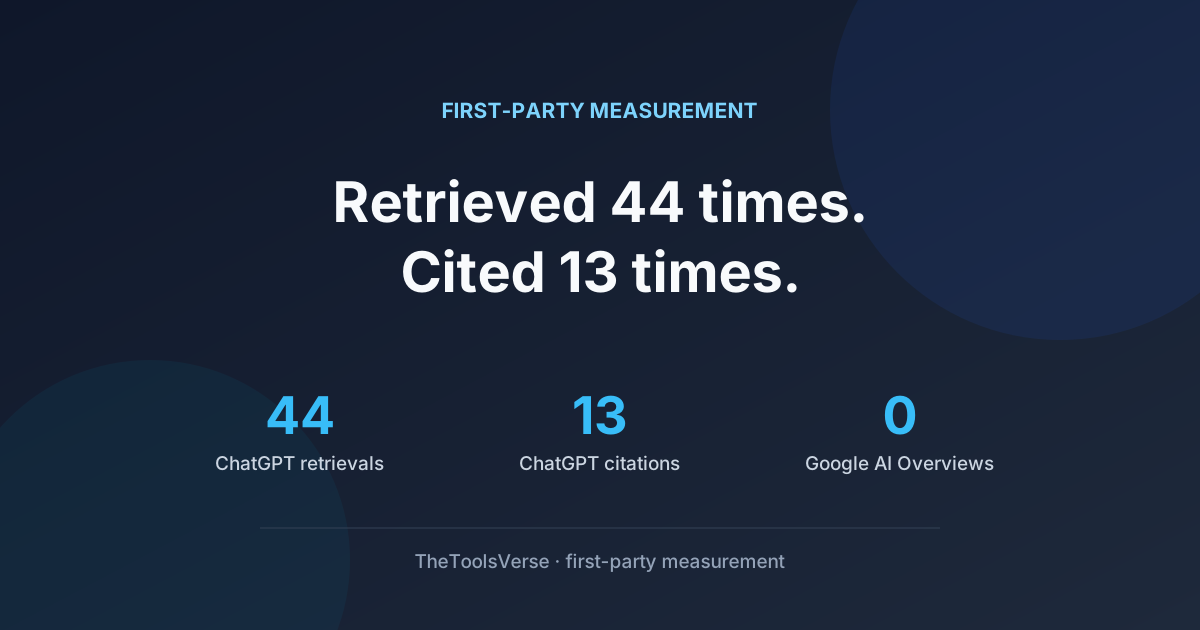
We Built a Content Audit. Then We Audited the Audit.
Disclosure
This article is promotional content produced as part of the Semrush Creator Accelerator programme. It contains an affiliate link to Semrush — if you buy through it we may earn a commission at no extra cost to you — and we may also receive a reward from Semrush for publishing it. The measurements, method and data in this article are our own and were not reviewed, supplied or approved by Semrush.
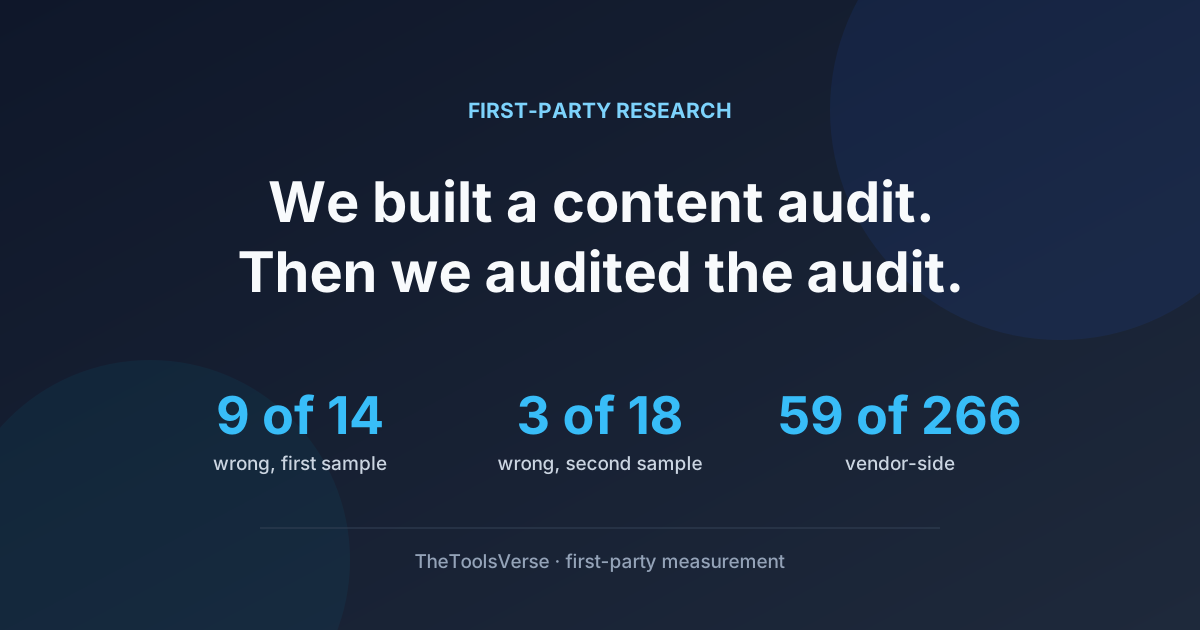
On 6 September 2026 we drew a random sample of our own tool listings and checked them against the vendors' own websites. Fourteen could be checked conclusively. Nine were wrong.
Two days and one correction programme later we drew a fresh sample. Eighteen could be checked conclusively, and three were wrong.
That is the headline, and it is the least interesting thing here. The interesting part came later, when we turned the same scrutiny on the log we had been recording all this work in — and found that it had been mislabelling its own data the entire time.
The question a directory isn't supposed to ask about itself
We publish factual claims about software at scale. As of today the catalogue holds 883 tools. Our verification log holds 822 individual dated facts across 207 of them — prices, free-tier limits, what a product actually is.
Until 6 September we had no measurement of how many of those claims were correct. Not a bad measurement. None. We had a review methodology and a lot of confidence.
This is the gap Semrush named in the trend brief this article responds to — "Practitioners have no systematic way to measure whether their content adds anything new, and no repeatable pipeline for producing first-party proof." We are answering that narrow question rather than the broader argument around it: not whether originality wins in search, which we have not measured and are in no position to claim, but what a repeatable pipeline for first-party proof actually looks like when you build one and run it on yourself.
Here is ours, including the parts that did not work.
How we drew the sample
The population is not the catalogue
We sampled the unverified pool — listings nobody had individually checked. On 6 September that was 373 pages. By 8 September it was 305, because pages leave the pool once they have been verified.
Note that number carefully, because it is the biggest limitation in this article and it appears again later. The two samples did not come from the same population.
The seed is printed on purpose
The draw was stratified by Bing impressions — one stratum for pages with real demand, one for the tail — and seeded. The second run's seed was toolsverse-2026-09-07-B, and we print it for a specific reason, recorded in the report at the time: so the draw cannot be quietly re-rolled until it returns a comfortable answer.
An unprinted seed is not a method. It is a promise.
What counts as wrong
Fixed before scoring, and carried between runs unchanged so the two were comparable:
| Score | Definition |
|---|---|
| WRONG | A material error a reader would hit: wrong price, a free tier that does not exist, the wrong product, a dead site |
| PARTIAL | We assert specifics the vendor does not publish, or figures are stale but not false |
| OK | Substantially matches |
What we refused to score
Pages we could not read — client-rendered pricing, failed fetches — were excluded from the rate entirely, on the principle that a page we could not read is a finding about us, not evidence either way.
This is not a small exclusion.
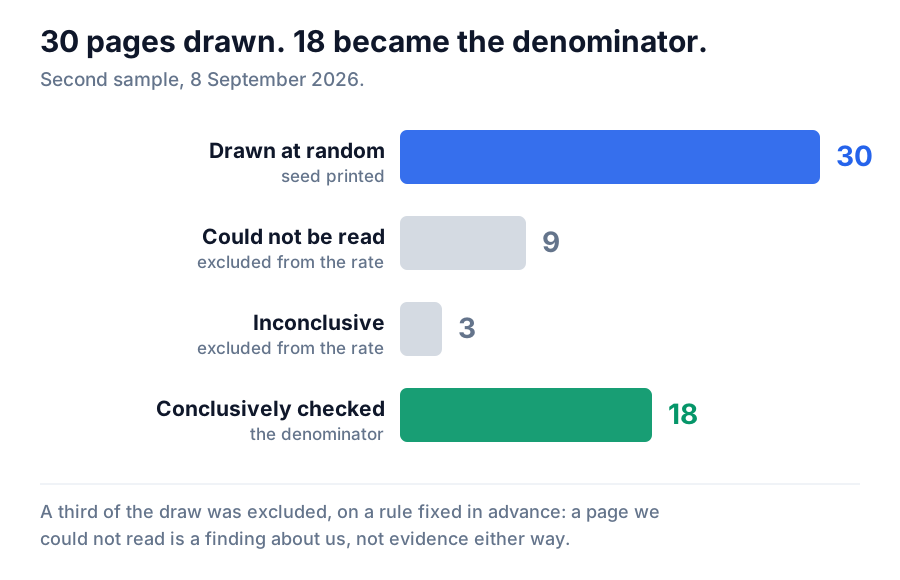
In the second run, 9 of the 30 pages drawn were excluded on those grounds. The rate that follows describes pages we could read. It is not a statement about the other third.
What the samples found
| Date | Conclusive | Wrong | Rate | Wilson 95% CI |
|---|---|---|---|---|
| 2026-09-06 | 14 | 9 | 64% | 38.8% – 83.7% |
| 2026-09-08 | 18 | 3 | 17% | 5.8% – 39.2% |
Those are small samples and wide intervals, and the intervals overlap. Anyone who tells you 64% → 17% is a clean 47-point improvement is reading two point estimates and ignoring everything underneath them.
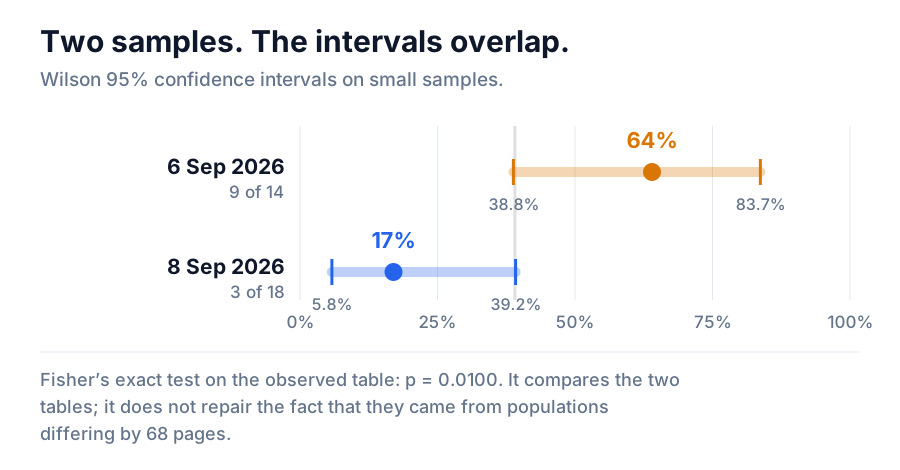
What carries the claim is the test, not the intervals. Two-tailed Fisher's exact on the observed table:
| Wrong | Right | n | |
|---|---|---|---|
| 2026-09-06 | 9 | 5 | 14 |
| 2026-09-08 | 3 | 15 | 18 |
p = 0.0100. A difference this large would be uncommon if nothing had actually changed.
But Fisher's exact compares the two tables as observed. It does not repair the fact that they came from populations differing by 68 pages. This is an observational before-and-after, not a randomised experiment. We did not assign anything to anything. We measured, changed things, and measured again — and the second measurement was taken from a pool the first one had been shrinking. That limitation cannot be tested away, and the number should be read with it attached.
There is a reasonable argument that the design still supports the conclusion, and it is in the limitations section below rather than here, because the limitation should reach you before the defence of it does.
One of the three
visme-ai-design-presentation-maker, a page with 523 Bing impressions. We published Starter $29 / Pro $59. Visme's own pricing page published $12.25 and $24.75 per person per month billed annually — $147 and $297 per year. (Re-checked on the vendor's live page on 2026-09-23: still $12.25 and $24.75, $147 and $297.)
The annual figures divide exactly by twelve into the monthly ones, which is the cross-check that they were read rather than guessed off a layout. We were overstating by more than double — in the direction that costs a reader a tool they could have afforded.
No scanner had ever flagged that page. Nobody suspected it. That is the whole reason for sampling at random rather than checking the pages that look suspicious.
The turn: our own log was wrong about its own data
Everything above is an audit of our listings. This is an audit of the instrument.
What changed was supposed to mean
Our verification log assigns every fact a status. One of them is changed, and the log defines it itself: "We previously published a different value; the vendor has since changed it."
By its own definition, that is a vendor-side category. It means the world moved and we were correct at the time.
What 266 records actually contained
There are 266 facts with that status, across 167 tools. We classified every one of them on the evidence written in the record's own text — and deliberately never used the status label as an input, because the label was the thing under test.
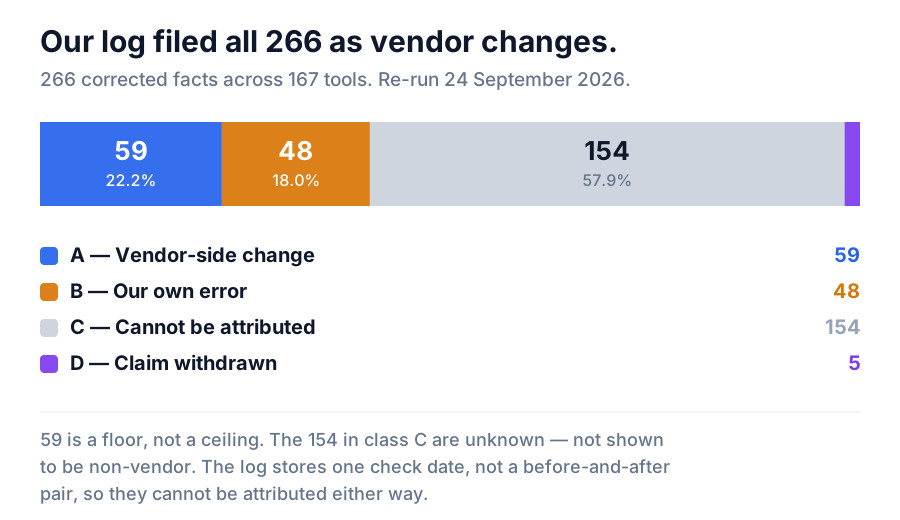
| Class | Meaning | Count | Share |
|---|---|---|---|
| A | Demonstrable vendor-side change | 59 | 22.2% |
| B | Demonstrable error of ours | 48 | 18.0% |
| C | Not attributable from the record | 154 | 57.9% |
| D | Unsourceable claim we withdrew | 5 | 1.9% |
59 of 266 carry evidence of the thing the label claims for all 266.
Two things that sentence does not say, both of which matter.
It does not say only 59 vendors changed anything. 59 is a floor, not a ceiling. The 154 in class C are unknown, not shown to be non-vendor — some of them are certainly vendor-side moves whose records simply do not say so.
And it does not say the log was dishonest. Every entry was written under a rule the log states about itself: "NEVER add an entry without actually performing the check described in method." The checks were real. The category they were filed under was wrong.
Why 154 can never be resolved
Here is the structural reason, and it is the most useful thing in this article for anyone building their own verification system.
Our log stores one check date. It does not store a before-and-after pair. Each record captures the corrected state — what the vendor publishes today, verified today — and not the prior state we had published. So "did the vendor move, or were we wrong?" is answerable only where the note happens to mention it.
Where it does not, the honest classification is "cannot say". Resolving those 154 would need the vendor's page as it stood on the earlier date, which we do not hold and cannot reconstruct.
The transferable lesson
A verification log that records outcomes but not prior states structurally cannot attribute cause. We did not discover that by reasoning about it. We discovered it by hitting it, after the data was already collected and it was too late to change the schema.
If you are building one: store the value you had, not just the value you found.
The parts that did not work
A correction programme that only publishes its wins is marketing.
Our detectors were mostly wrong on their first run. The machine-written-copy scan's first pass returned 93% false positives — 129 prose hits, nearly all of them legitimate writing. It took four tuning passes against real false positives before it was usable. Budget for that. A detector shipped on its first run will bury you in noise and you will stop trusting it, which is worse than not having it.
And we do not test products. Of 207 records in the verification log, exactly one used the method first-party-test. The rest is desk verification — reading vendors' own public pages and documentation on a dated basis. Our log forbids us the other word explicitly: "Do not write 'tested' unless a first-party account/product test was actually run."
That distinction is worth taking seriously in your own work. Claiming to have tested a few hundred tools and having read a few hundred pricing pages are different claims, and only the second one is usually true.
We use the same rule for failure. The log separates not-checked-by-us from vendor-unpublished, under an instruction it states in capitals: "never describe our own failure as the vendor's opacity. A blocked scraper is 'not-checked-by-us'. A login wall is 'login-required'. These are opposite findings." Of our 822 facts, 124 are not-checked-by-us — a count of our own gaps, kept deliberately visible rather than folded into something that sounds like the vendor's fault.
Run this on your own catalogue
- Define your statuses before you look at anything. WRONG, PARTIAL and OK, written down, with examples. Deciding what counts as wrong while you are looking at a page you wrote is not scoring.
- Define the population, and know that it moves. Ours shrank 373 → 305 mid-study. If you do not write down what you are sampling from, you will not notice when it changes underneath you.
- Print the seed. Publish it with the result.
- Decide the exclusion rule in advance, and report how many it removed. Ours removed 9 of 30.
- Store the prior value, not just the corrected one. This is the one we got wrong, and it cost us the ability to attribute 154 corrections. It is a one-line schema decision that you can only make before you start collecting.
- Re-measure, and test the difference rather than eyeballing two percentages.
Five of those six are free. The sixth costs an afternoon of reading vendor pages.
What these numbers do not say
The populations were not the same. The pool shrank from 373 to 305 between runs. This is the limitation that most affects how much weight the comparison carries, and no statistical test removes it.
The argument that the design still supports the conclusion is this: the pages that left the pool are precisely the ones we had fixed by hand, so the improvement cannot be explained by hand-fixing — those pages were no longer eligible to be drawn. What is left as an explanation is the catalogue-wide sweeps that corrected listings nobody ever inspected. That is a reasonable inference from the sampling design. It is not a controlled result, and we are not presenting it as one.
The rest, briefly:
- The samples are small. 14 and 18 conclusive. The confidence intervals overlap.
- The population is the unverified pool, not the catalogue. These rates say nothing about the pages that had already been checked.
- A third of the second draw was excluded as unreadable. The rate describes pages we could read.
- We scored our own work against rules we wrote. That is normal for an internal audit and it is exactly why the seed, the scoring rules and the exclusion policy are published with the numbers.
- We are not claiming the catalogue is now accurate. "3 of 18 sampled unverified pages carried a material error" is the claim. Inverting that into an accuracy figure for 883 listings would be two unsupported leaps, and we have already published two earlier audits — of free tiers and of pricing across the catalogue — whose figures describe their own datasets and not this one.
- We have not measured any link between this work and search rankings, and will not imply one. Different question, different study, and not one we have run.
Where this method stops
Everything above measures whether a page is accurate. It says nothing about whether a page is differentiated — whether it adds anything the internet did not already have.
Those are genuinely different problems, and the second one is harder. A listing can be perfectly accurate and completely redundant. In a directory that is the normal failure: copying a vendor's own pricing table correctly produces a page that is both true and pointless. Our detectors catch wrong. They do not catch unnecessary.
That is the gap Semrush's Content Toolkit is built around, and where we would point someone who has run the accuracy audit and wants to go further. Per Semrush's own documentation, checked on 2026-09-23, it contains six tools — Content Dashboard, AI Article Generator, Content Optimizer, Content Repurposing, Topic Finder and SEO Brief Generator — and the page describes the toolkit's purpose as helping you "Optimize your articles for visibility across Google and AI search engines." Of those six, the two that map onto the problem this article leaves unsolved are Topic Finder, which addresses what to write about in the first place, and Content Optimizer, which addresses whether a specific draft is worth shipping.
One correction worth making, in the spirit of the rest of this article. Semrush's own trend brief recommends the SEO Writing Assistant — which does include an originality check built on the Copyleaks Plagiarism Checker — and describes it as part of the Content Toolkit. Semrush's own knowledge base says otherwise: "SEO Writing Assistant is part of the SEO Toolkit." If originality scoring is what you are after, that is the product that has it, and it is in a different toolkit from the one the brief names. We have not used either — we are an affiliate, not a customer, and this is a description of Semrush's documentation rather than a review.
Semrush SEO Writing Assistant
Our audit measures whether a published fact is still true. It says nothing about whether a draft is original before it ships. Semrush documents that second check — built on the Copyleaks Plagiarism Checker — as part of the SEO Toolkit.
See the SEO Writing AssistantWhat we actually learned
The error rate was not the finding. We expected the catalogue to have problems; every catalogue does.
The finding was that the instrument we were measuring with was wrong about its own data, and that we only knew because we pointed the audit at it. For four fifths of a 266-record category, a label we had written ourselves was asserting something the records did not support — and it would have gone on asserting it indefinitely, because nothing about a confidently-labelled dataset looks broken from the outside.
Publishing your own error rate is more useful to a reader than asserting your accuracy, and it is cheaper than being wrong at scale in public. But it only works if you also check the thing doing the measuring.
Sources and method
Every figure in this article was re-derived on 24 September 2026 from the data it describes.
| Figure | Source | Date |
|---|---|---|
| 9 of 14, 3 of 18, Wilson intervals, Fisher's p | Two stratified random-sample audits, recomputed from raw counts | 2026-09-06, 2026-09-08 |
| 883 tools | Catalogue build output | 2026-09-24 |
| 822 facts across 207 records; 375 confirmed, 266 changed, 124 not-checked-by-us | Our verification log | 2026-09-24 |
| 266 classified as A 59 / B 48 / C 154 / D 5 | Deterministic re-runnable classification of each record's own text | 2026-09-24 |
1 of 207 first-party-test | Our verification log | 2026-09-24 |
| 93% false positives, four tuning passes | Detector tuning reports | 2026-09-06, 2026-09-08 |
| Visme's published prices | The vendor's own live pricing page | 2026-09-23 |
| Content Toolkit contents; SEO Writing Assistant's toolkit | Semrush's own knowledge base | 2026-09-23 |
Written by Sohail Akhtar. Sample statistics are historical measurements fixed by their dates; catalogue counts move and are stated as of the date above.
Some links may be affiliate links. We may earn a small commission at no extra cost to you.
Related Articles
Explore more guides and reviews from our experts.